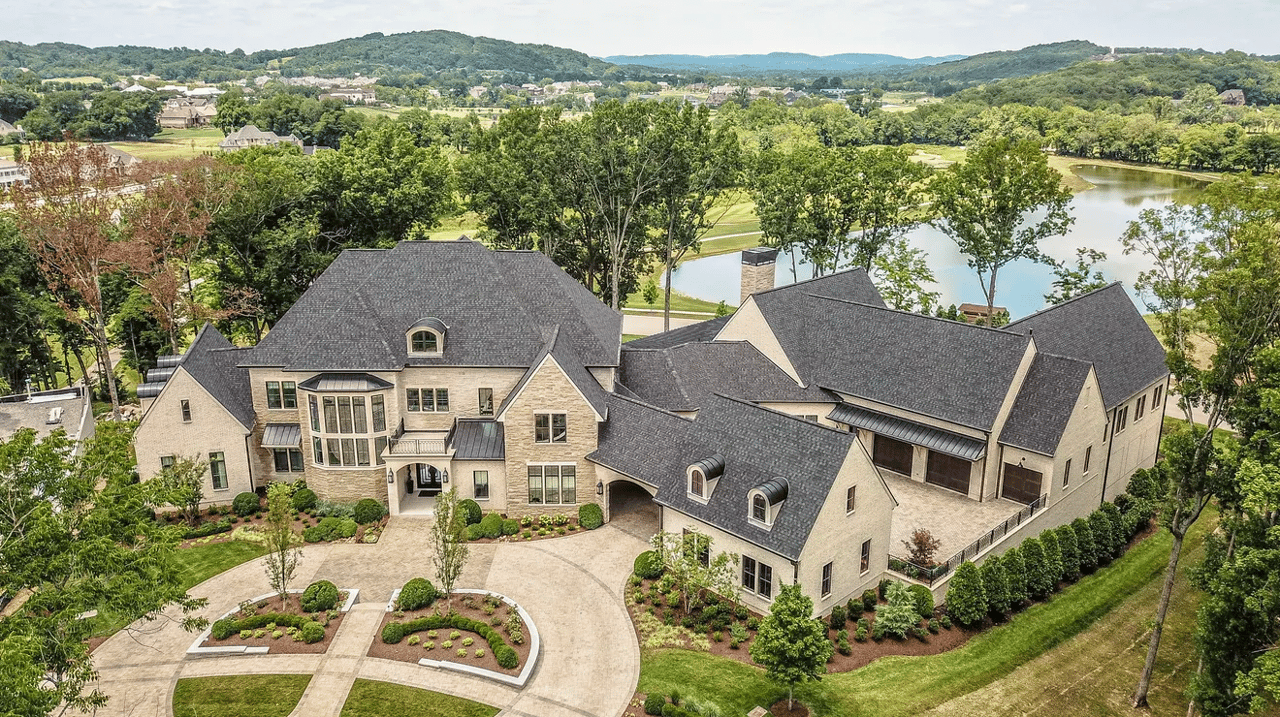
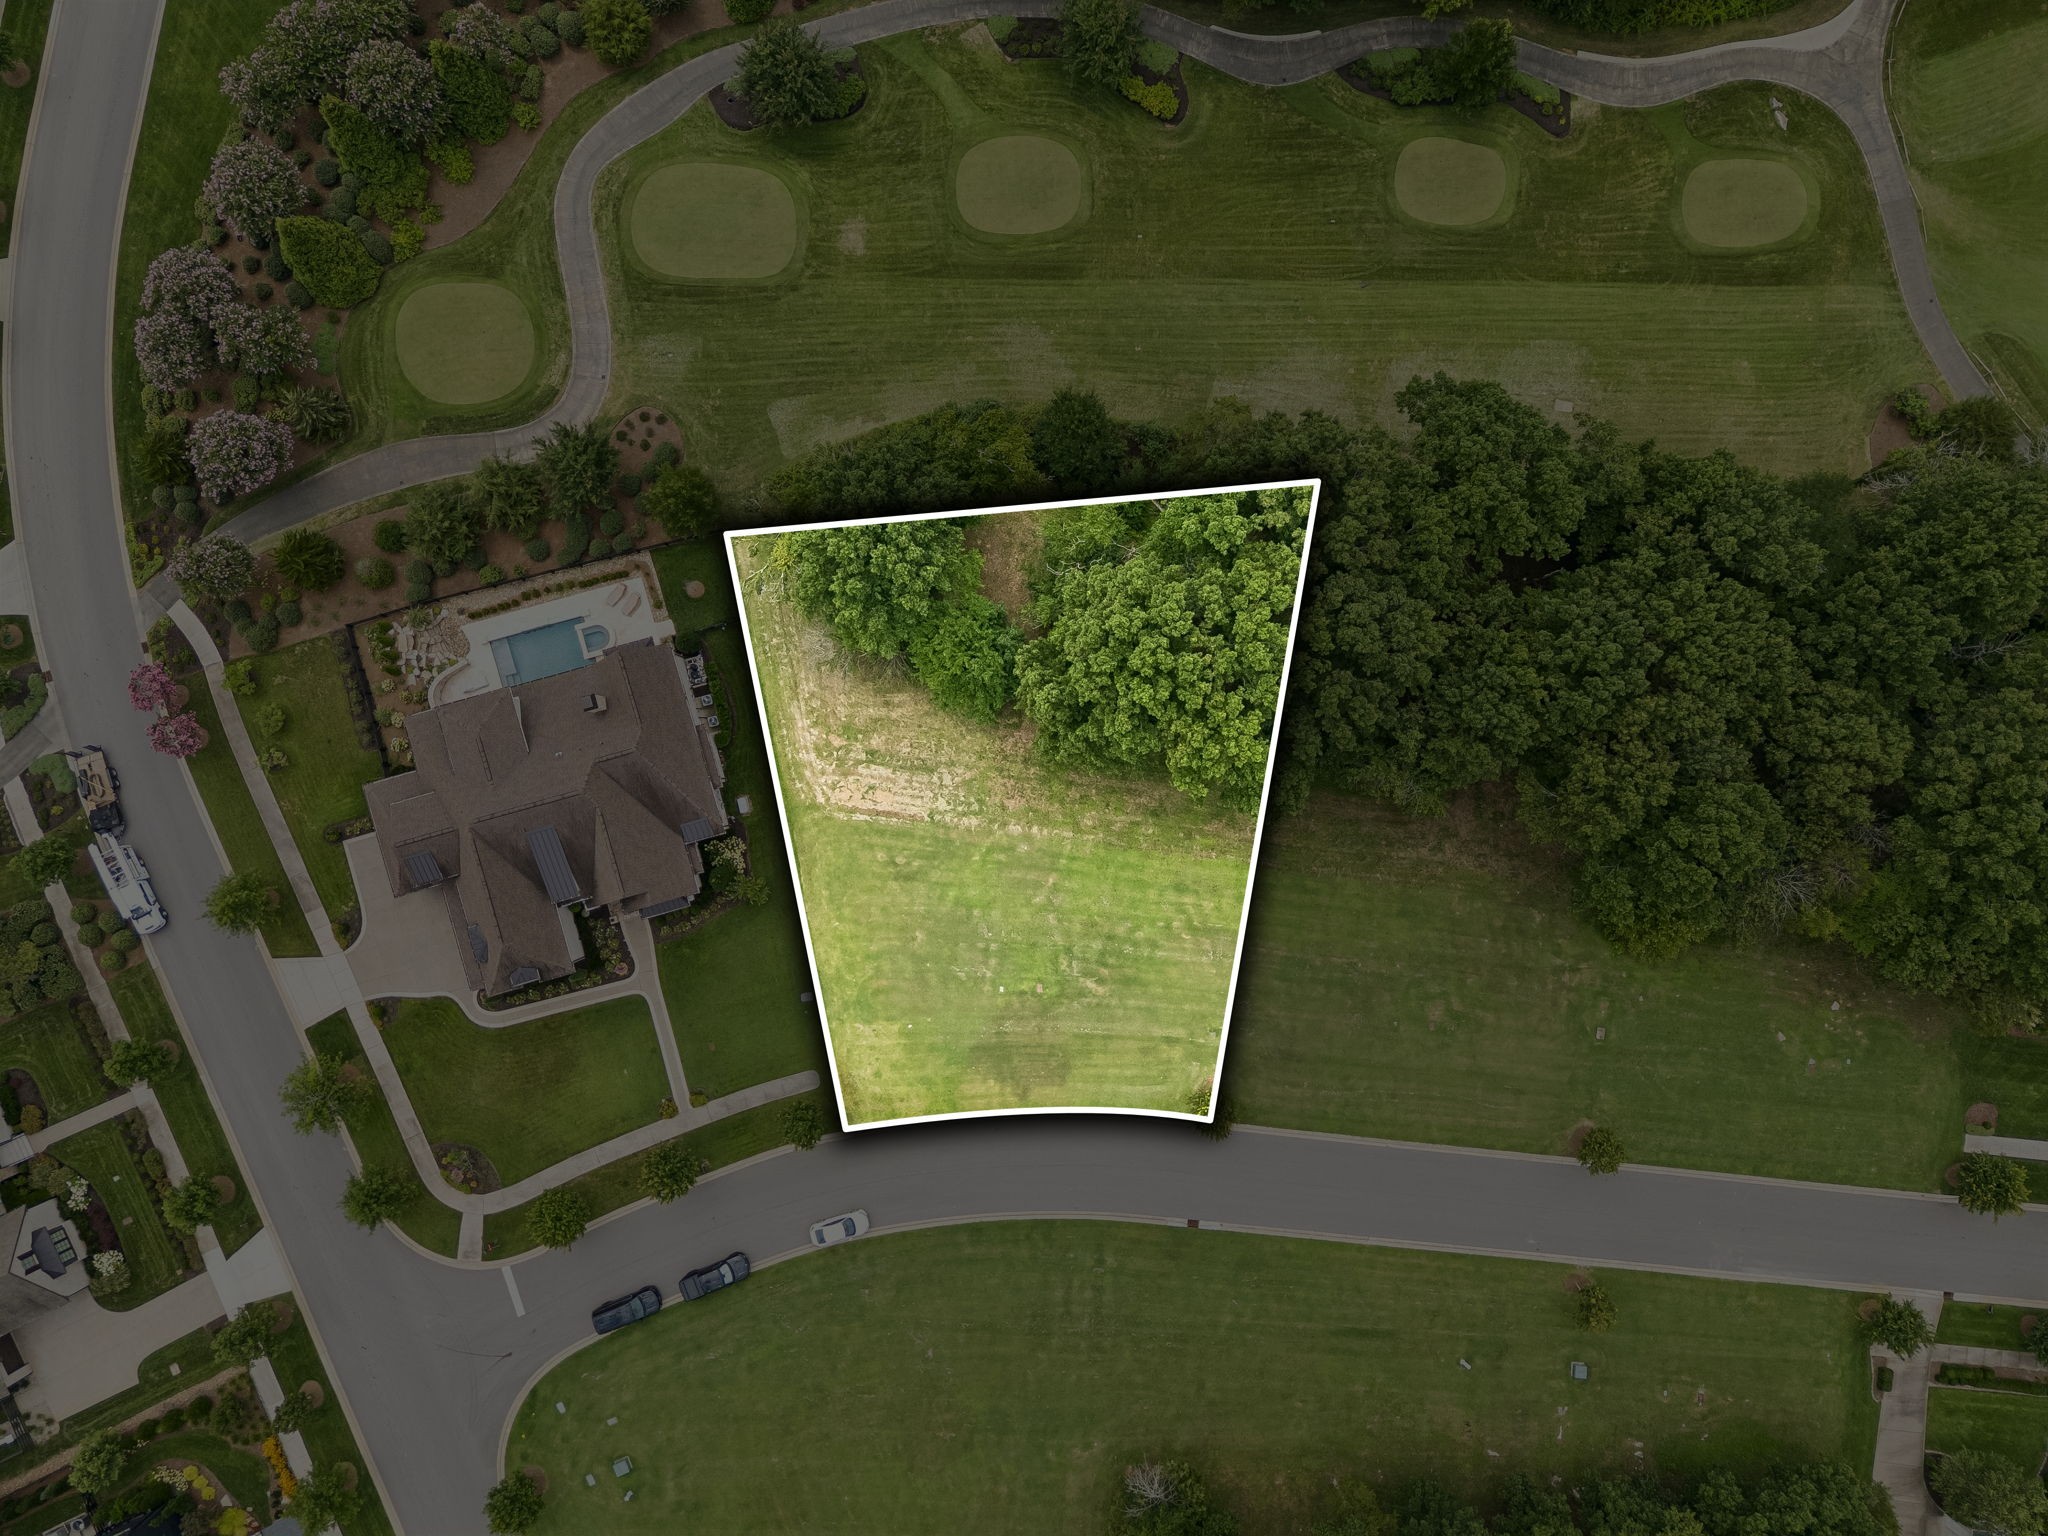
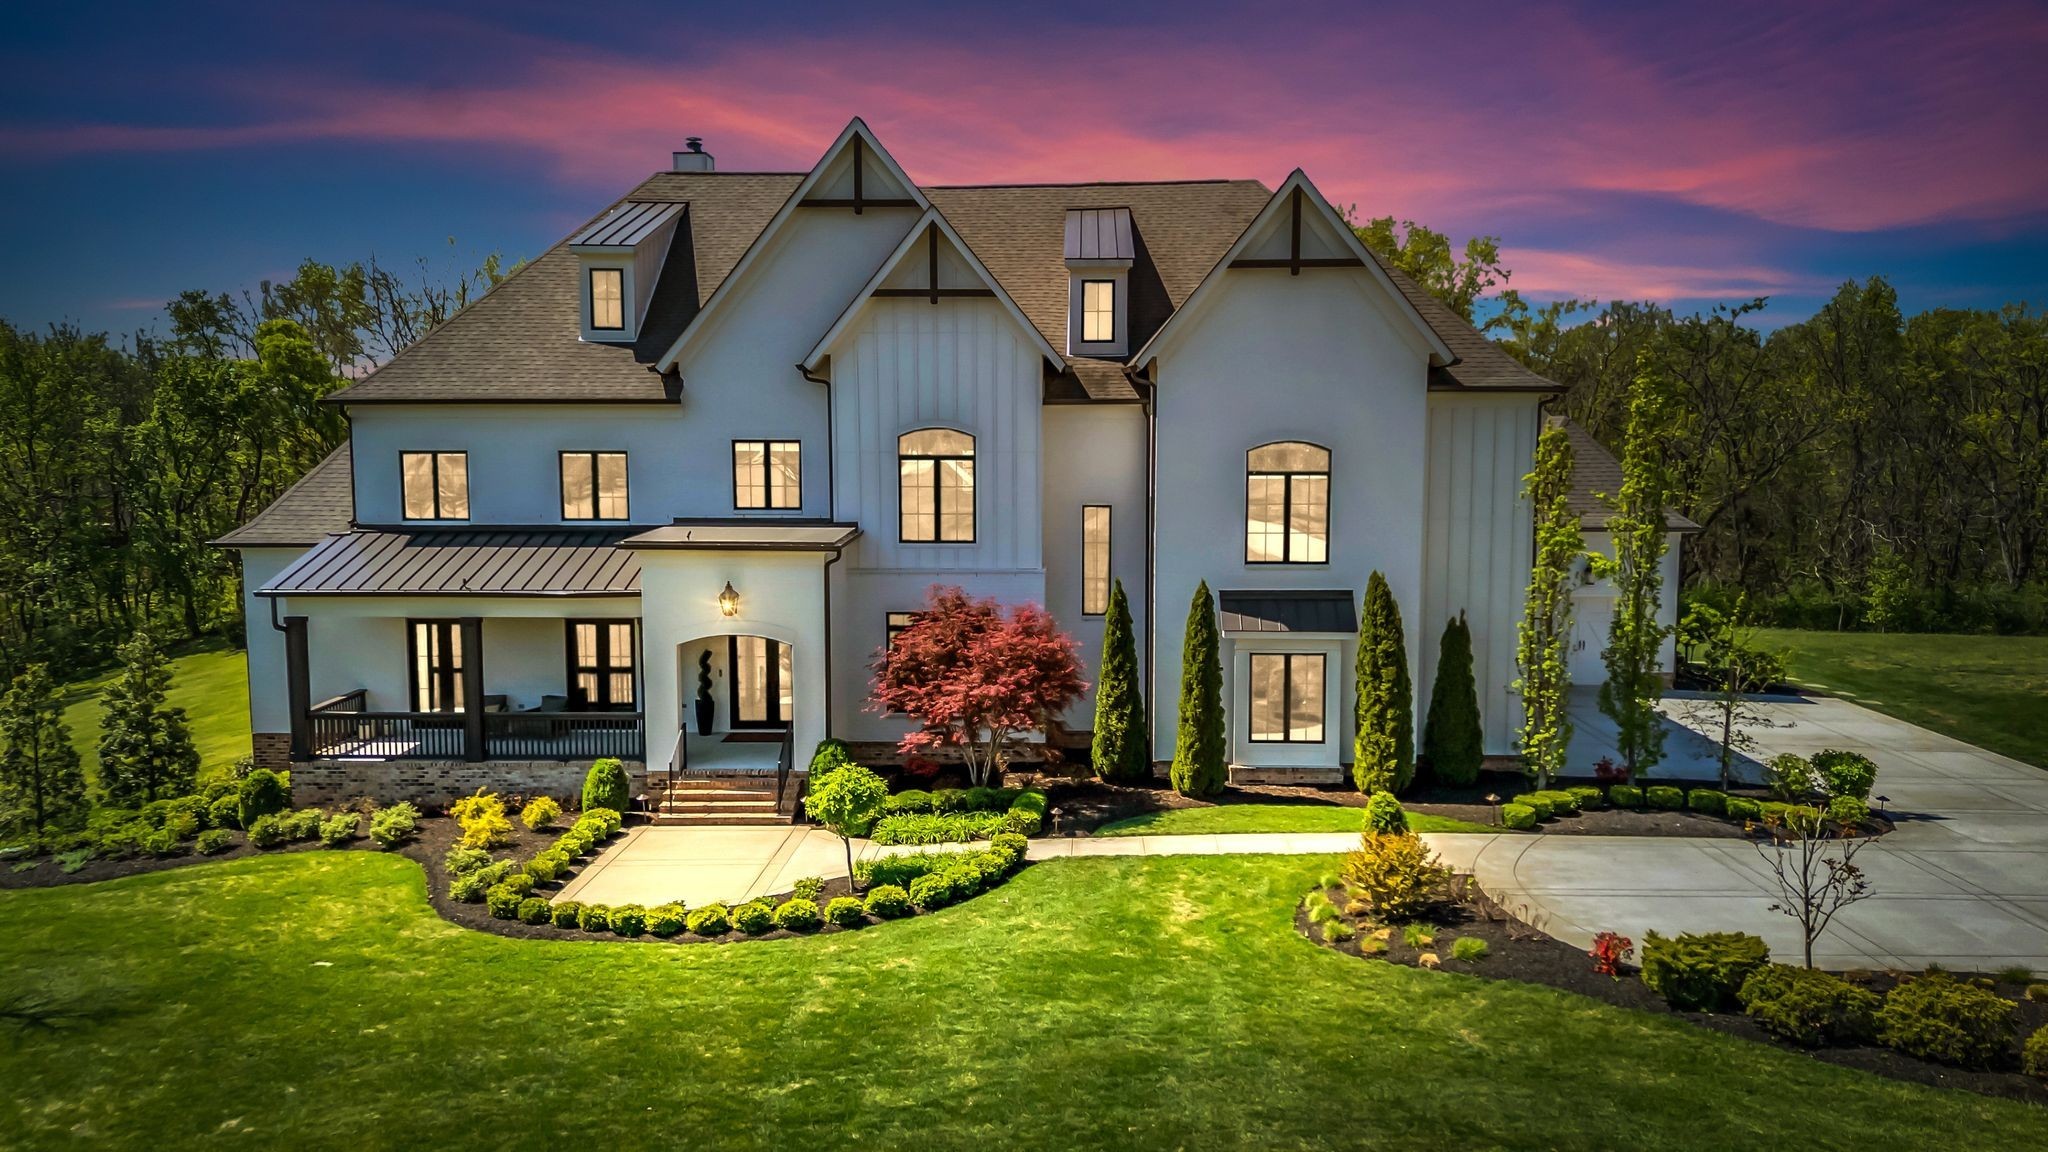
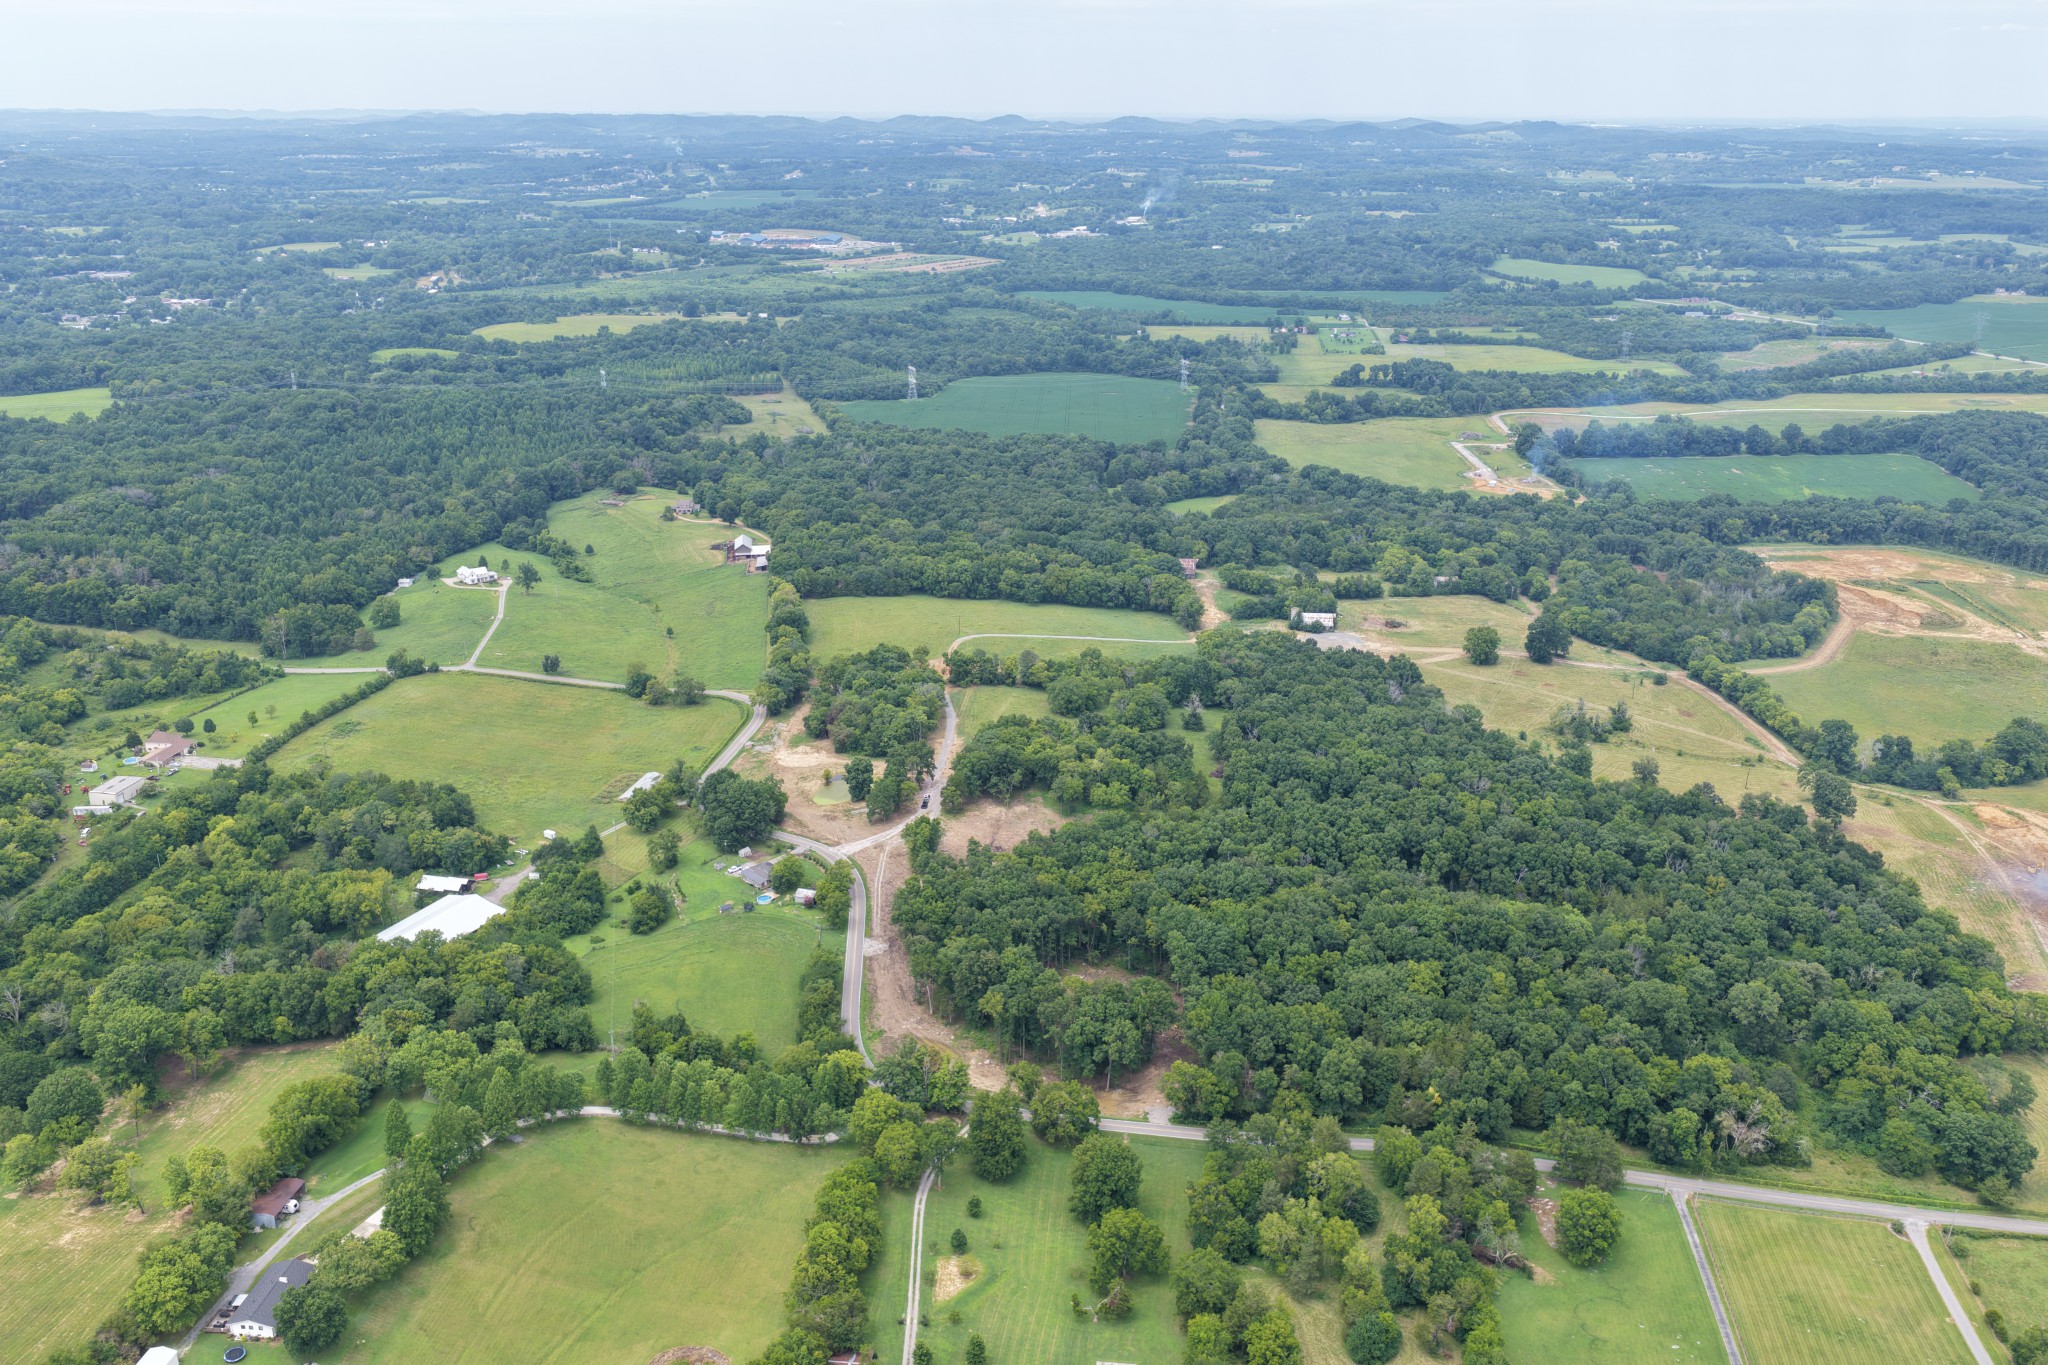
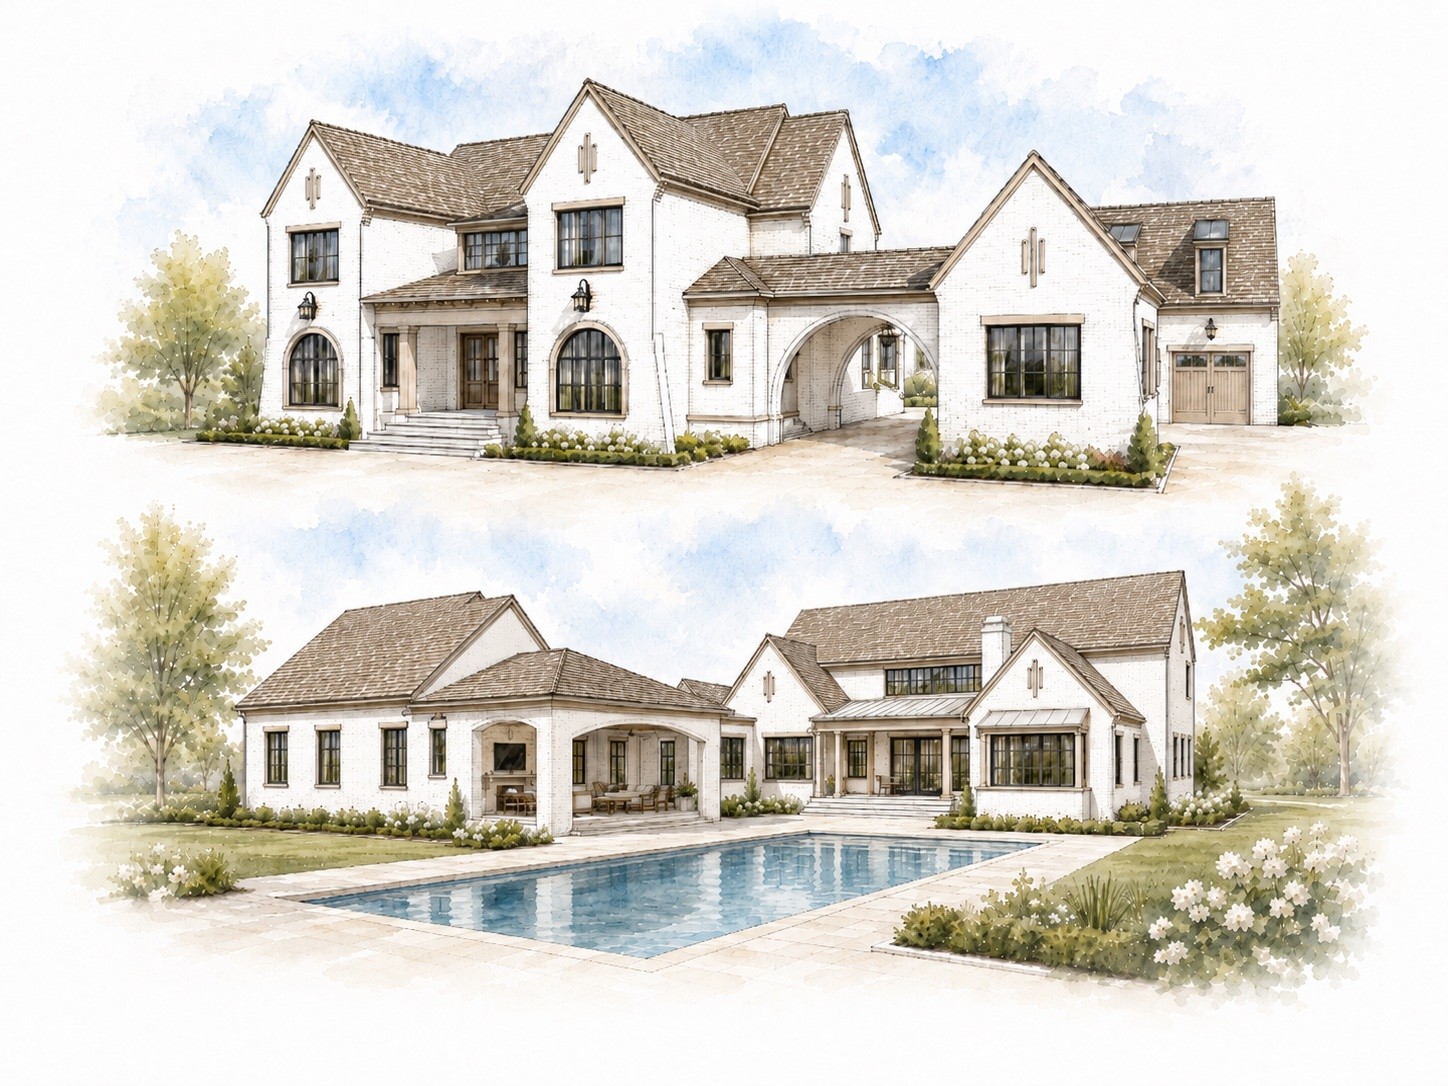
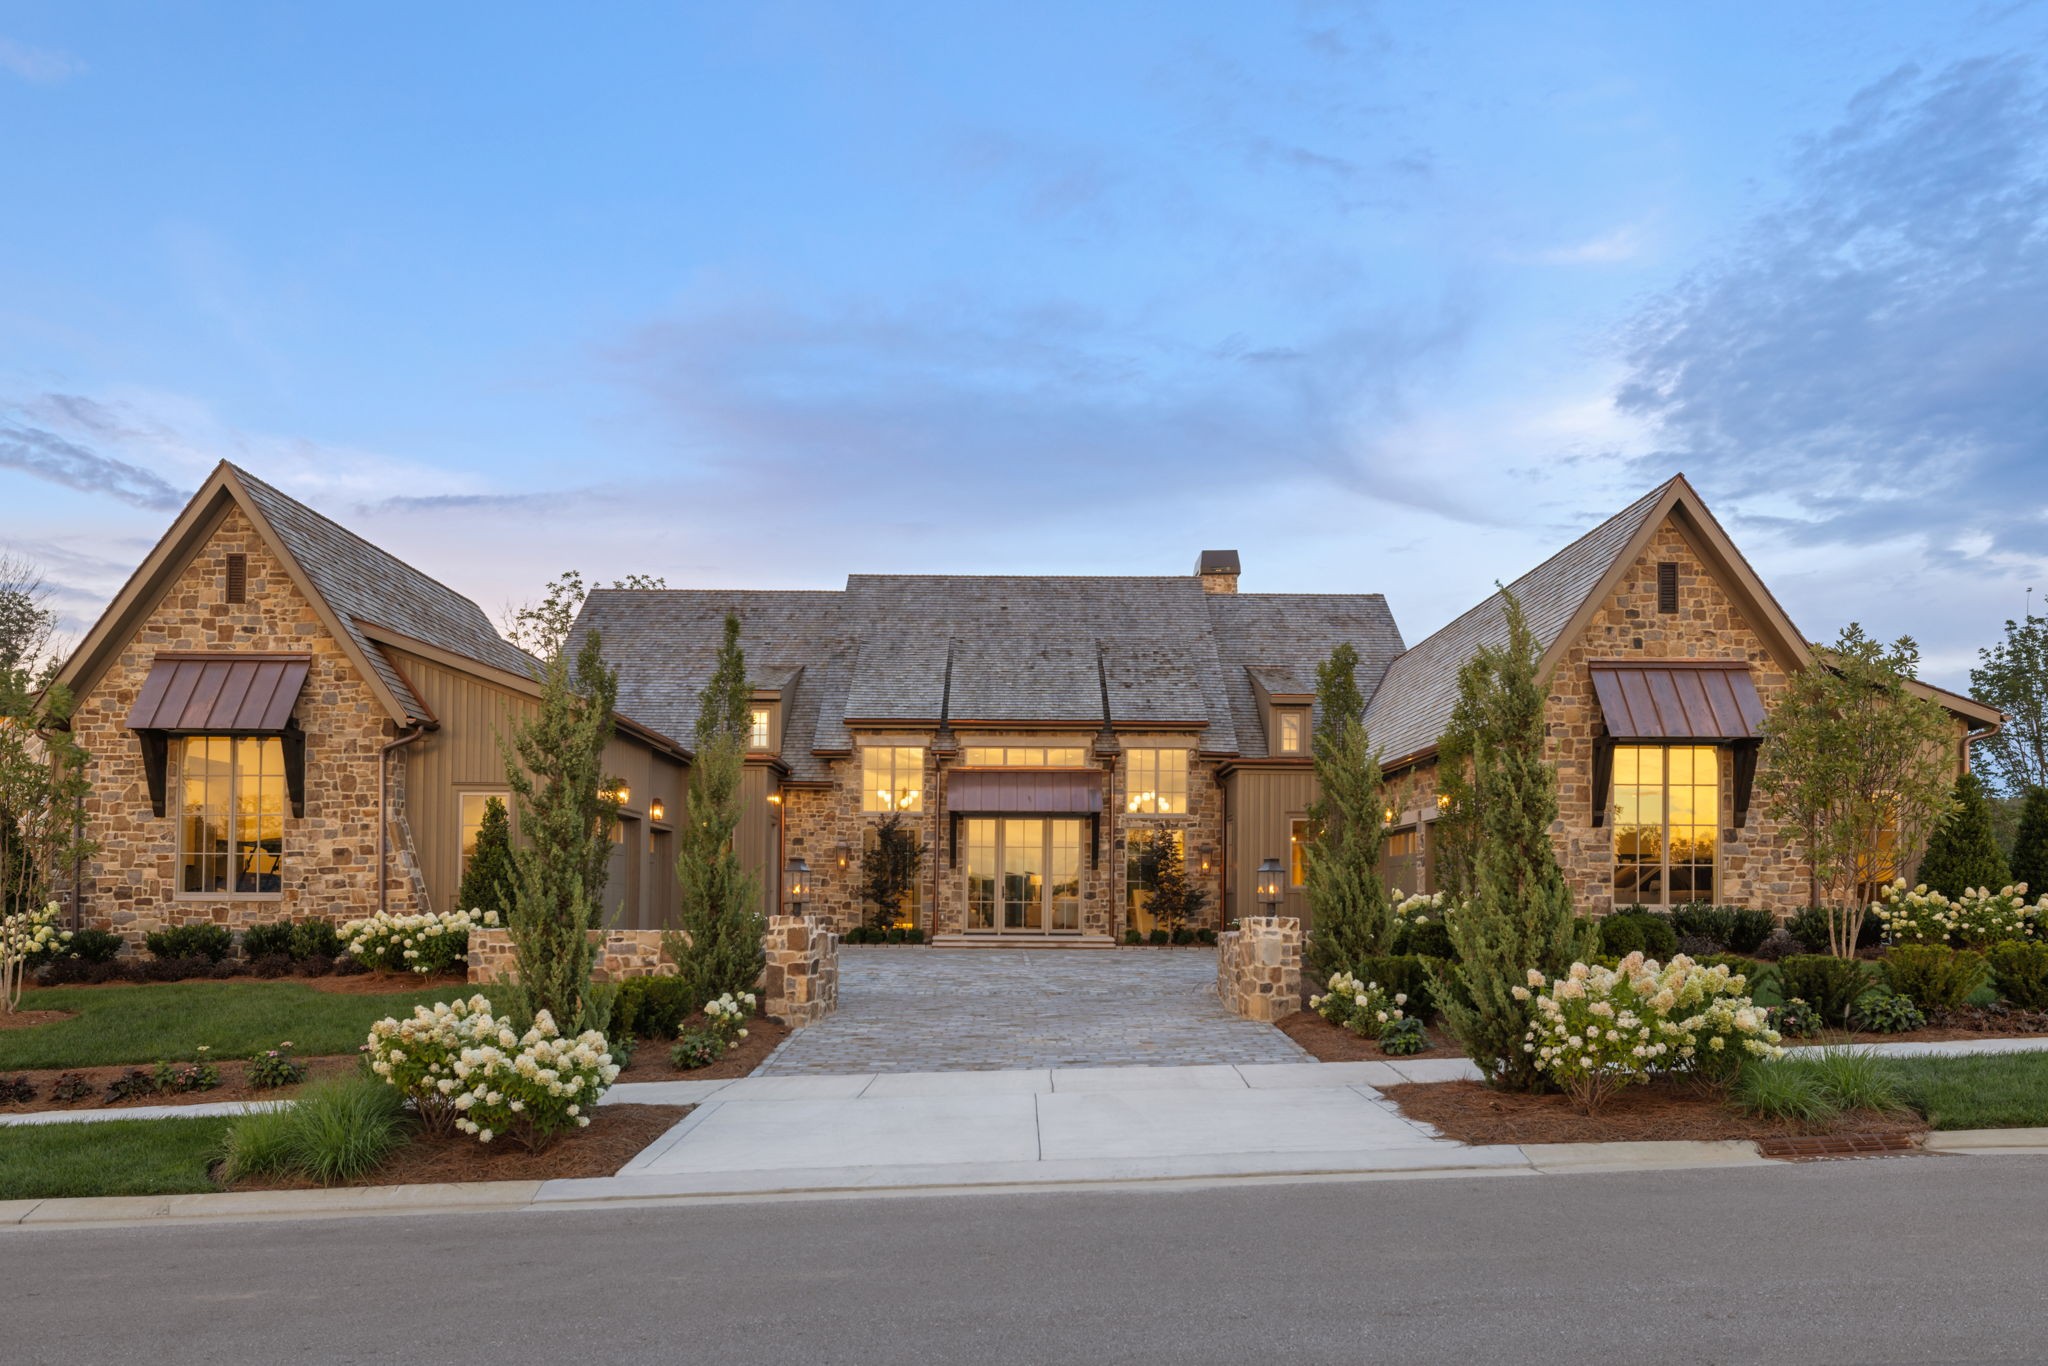
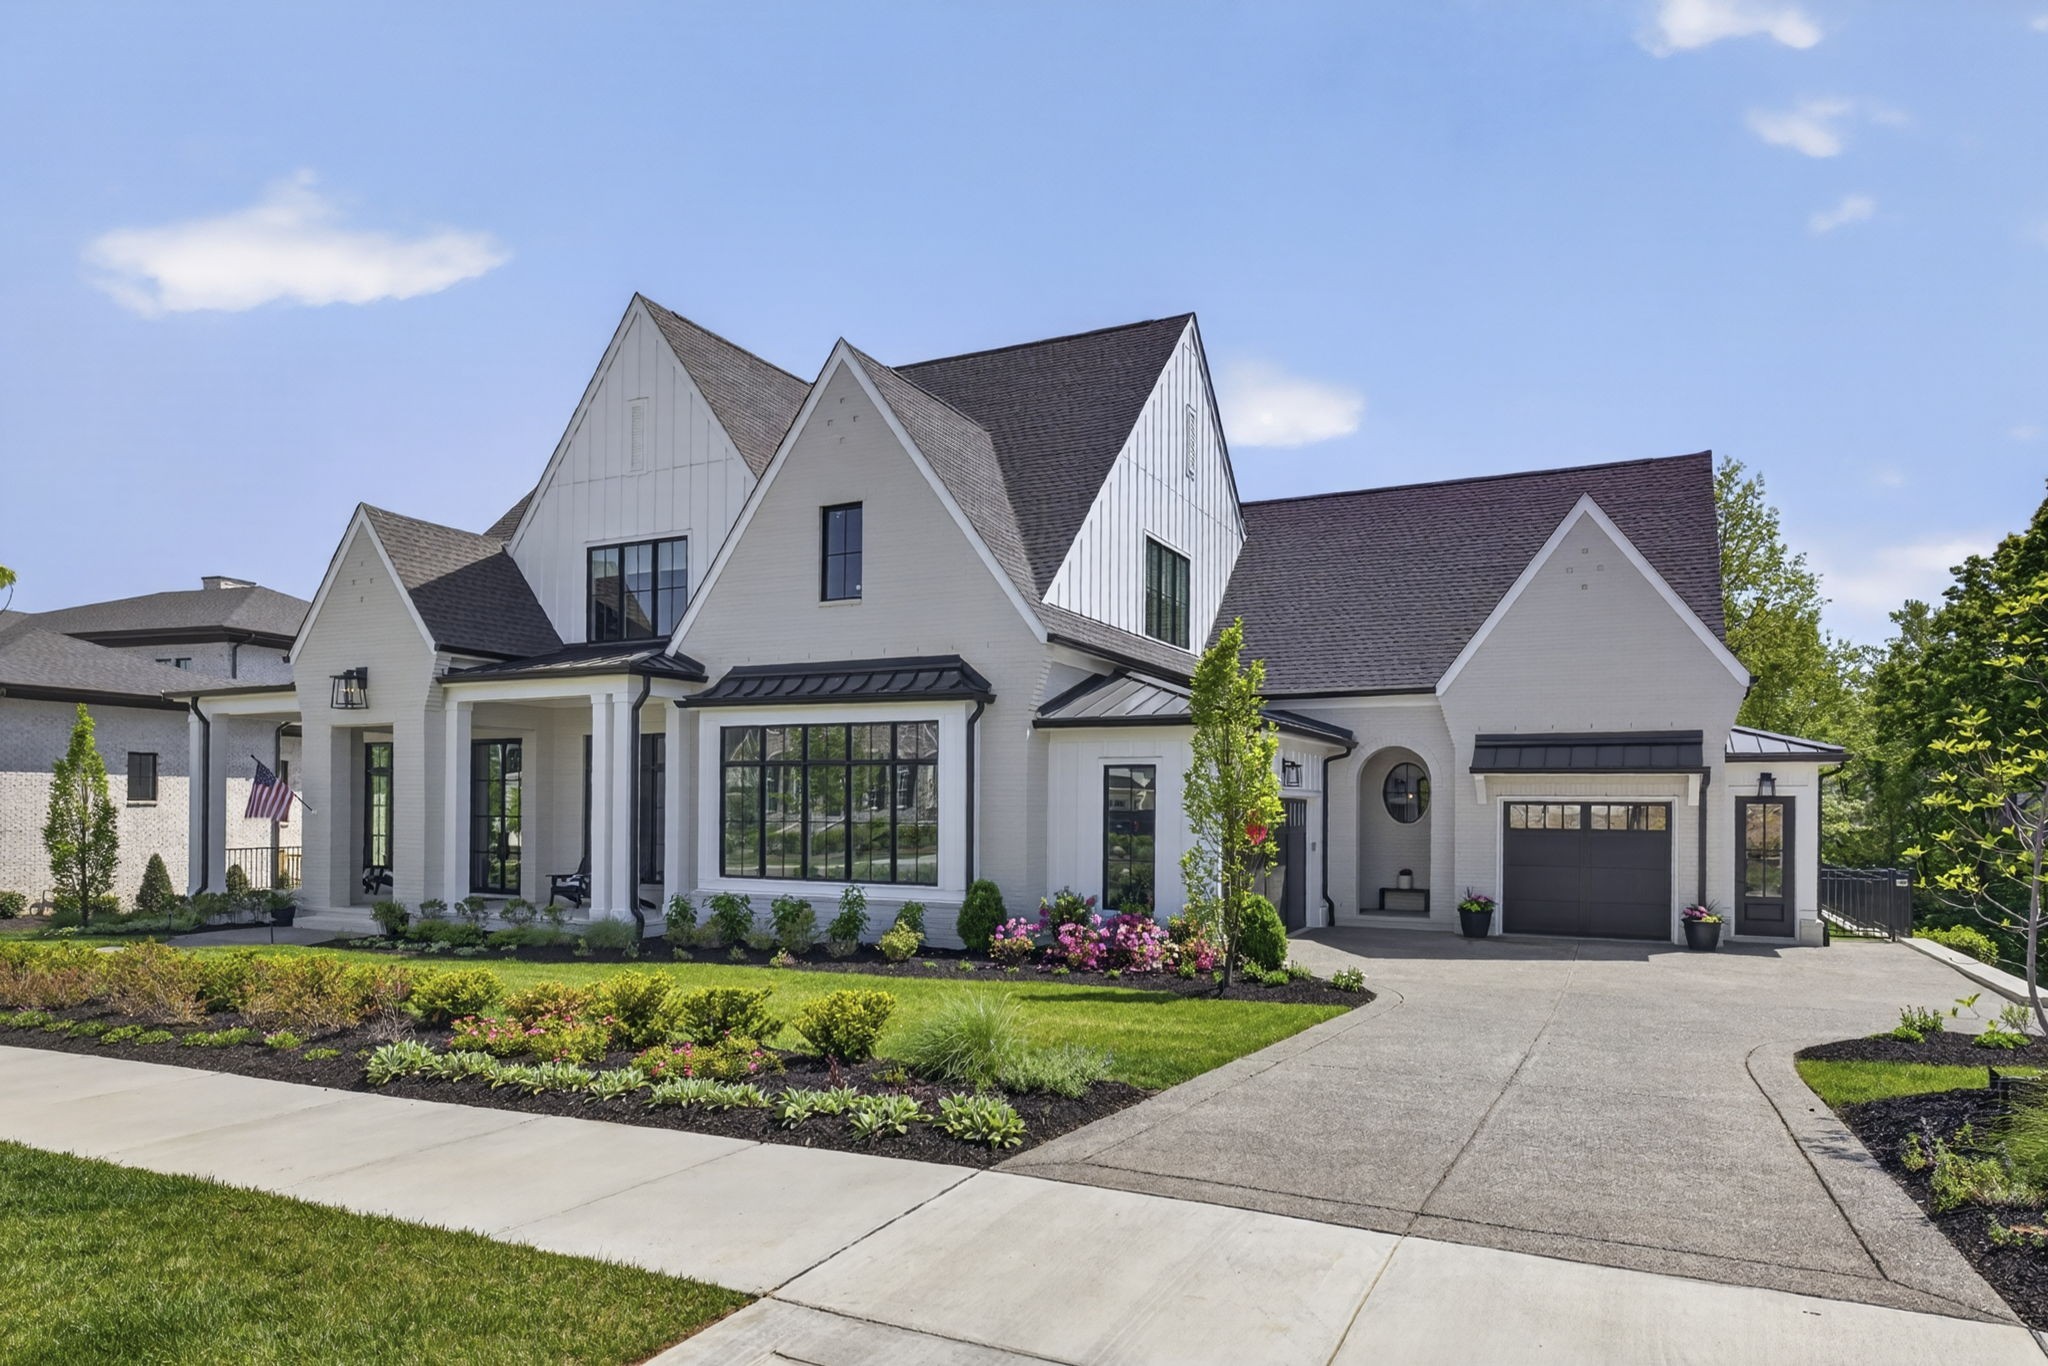
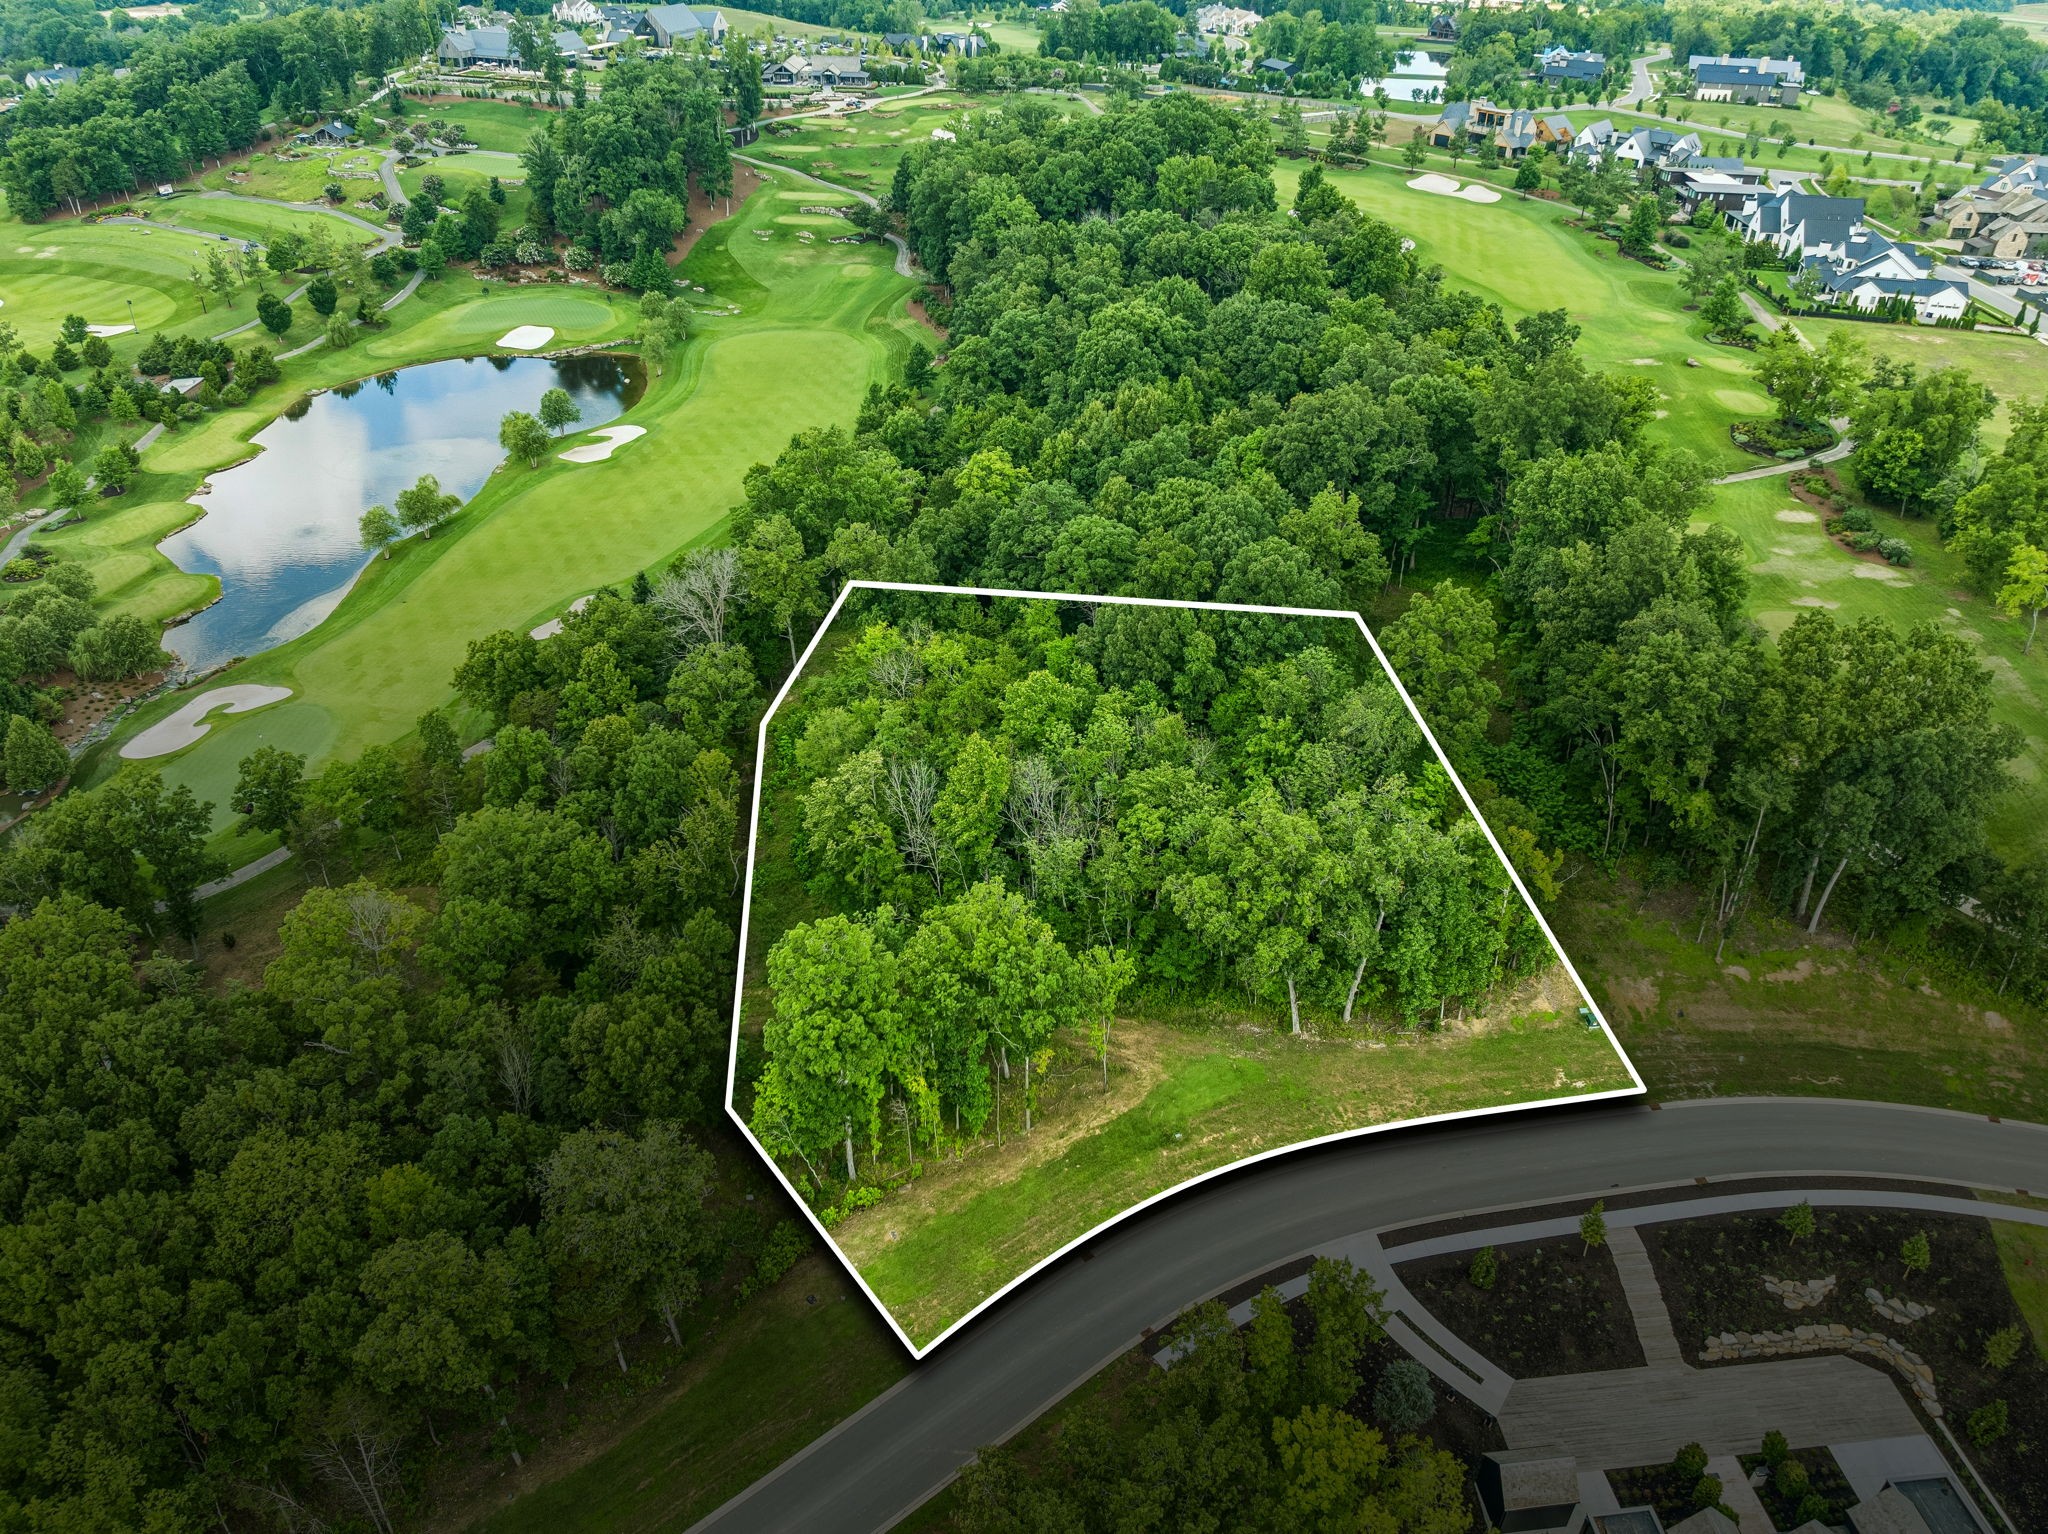
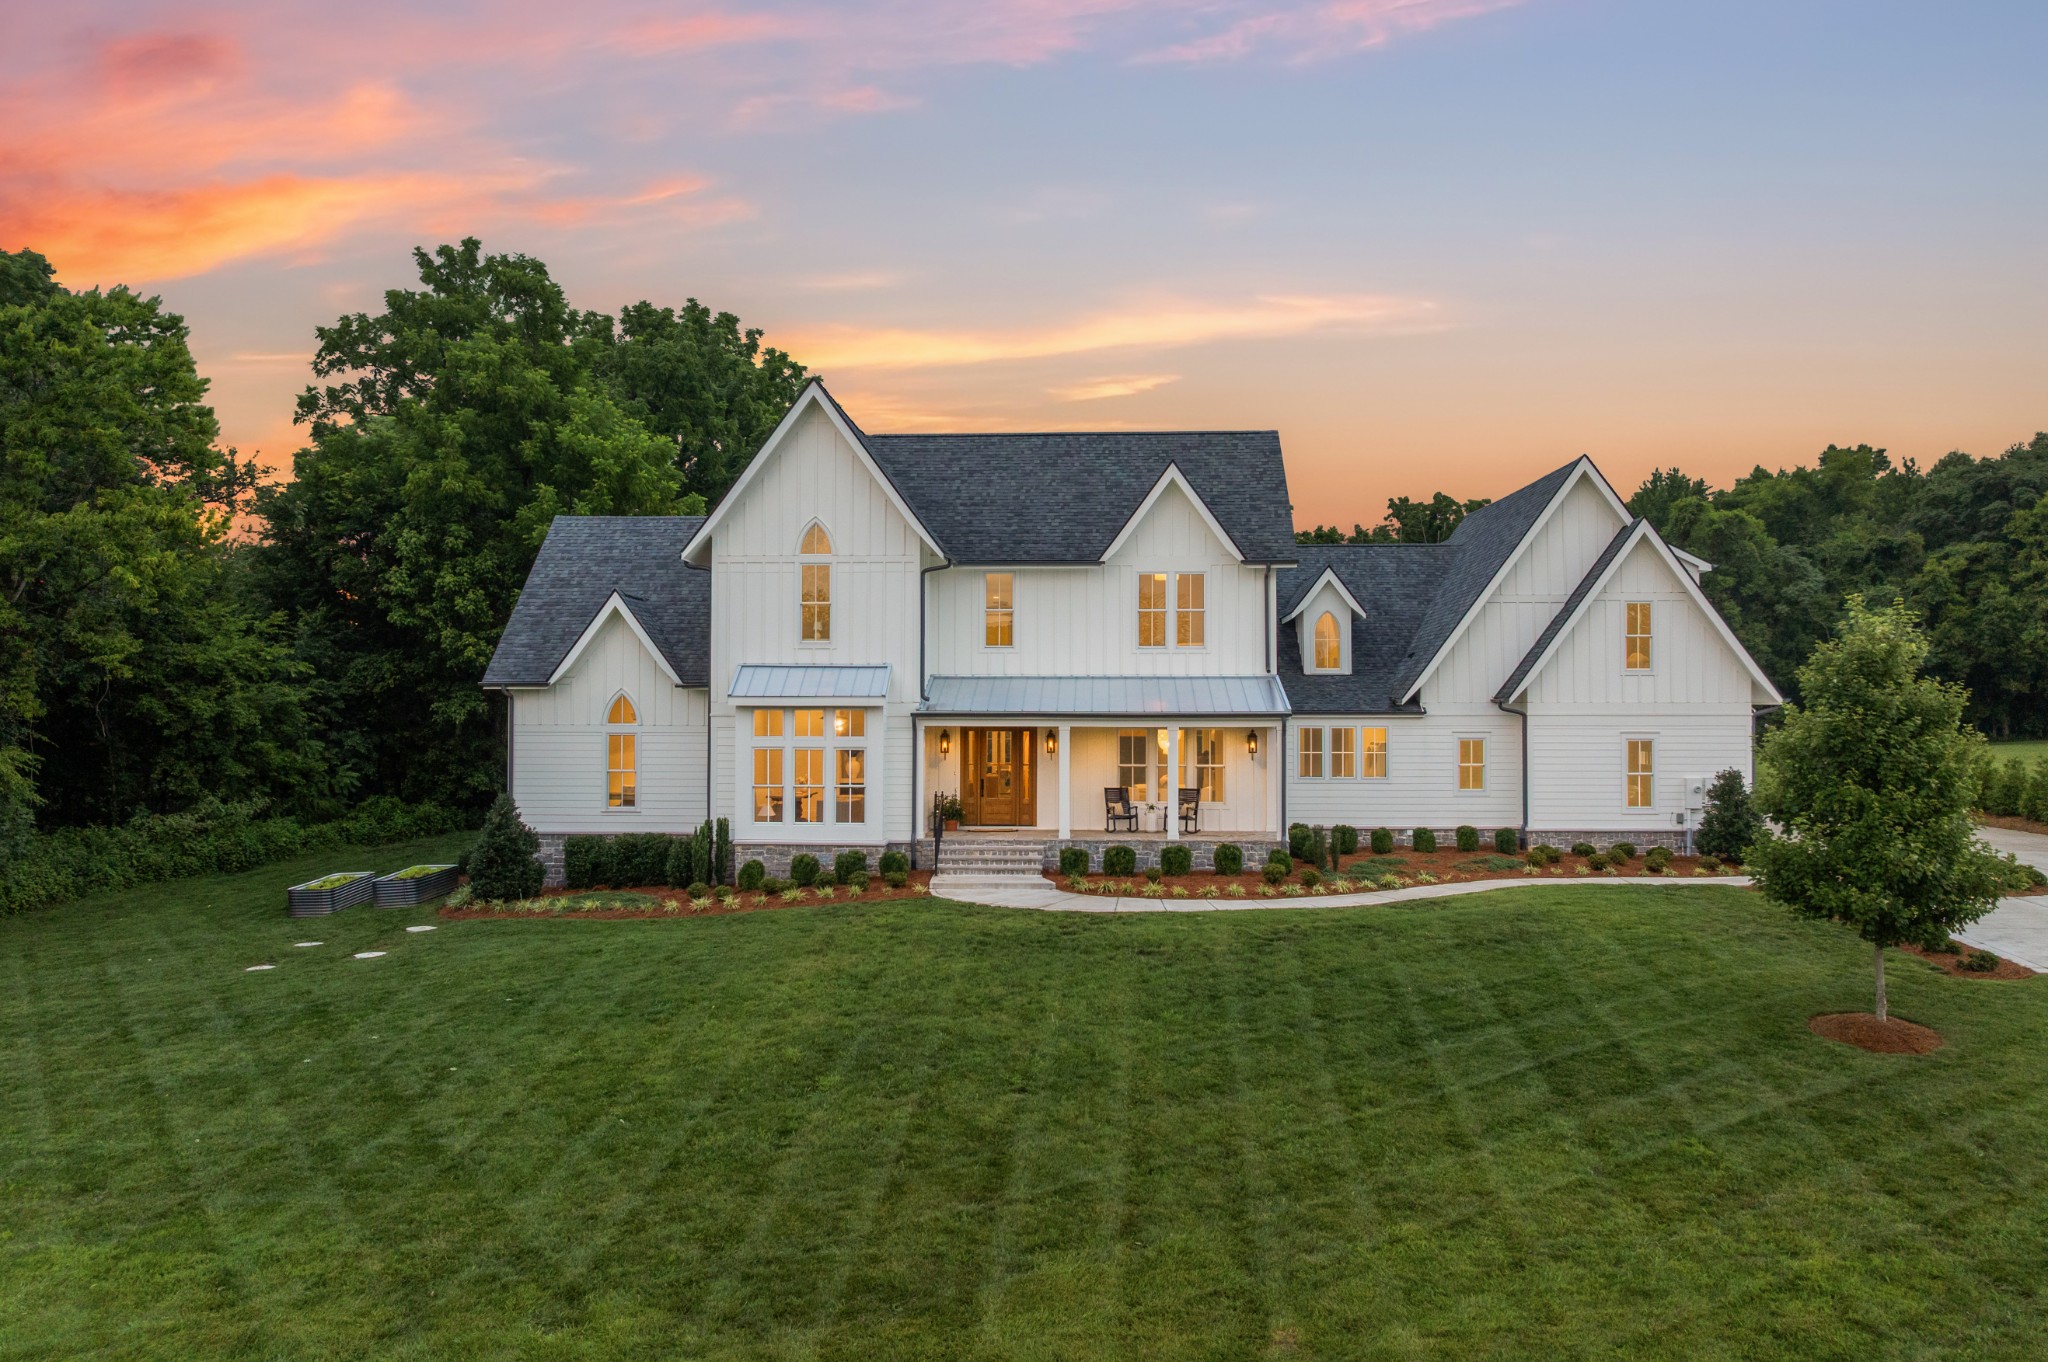
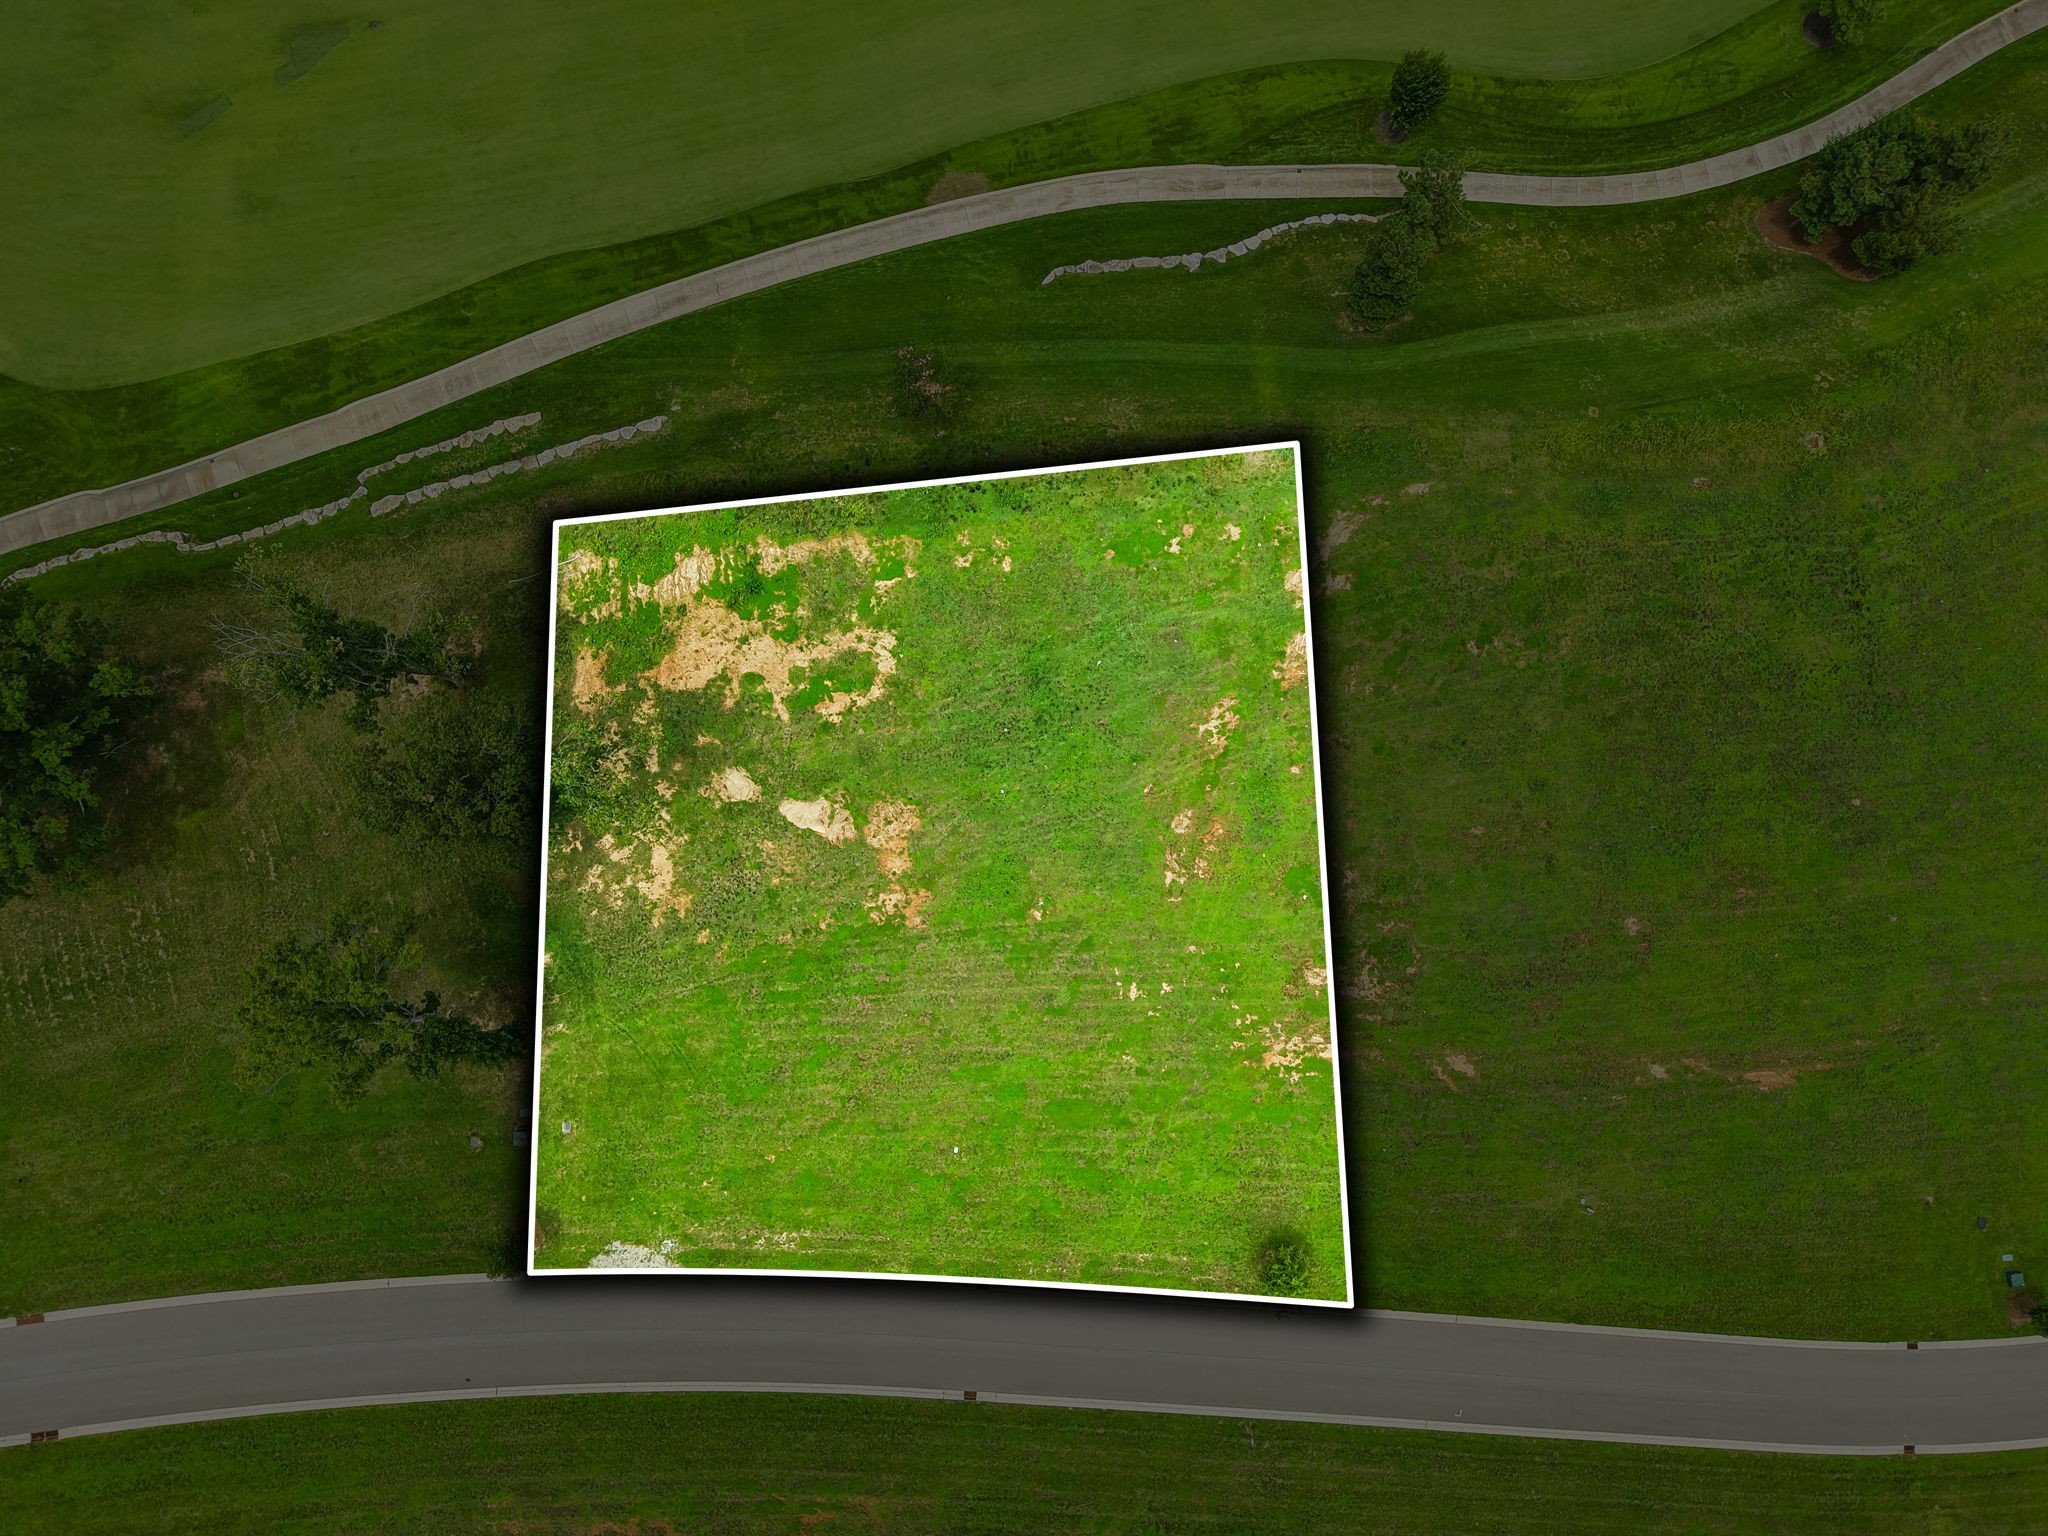
Living in College Grove means choosing wide-open beauty, privacy, and an elevated countryside lifestyle just beyond the bustle of town. What sets it apart is its expansive rolling farmland, quiet roads, and luxury estate living—homes with space to breathe, long driveways, and uninterrupted views of Tennessee hills. It’s also home to sought-after gated golf and resort-style communities, where world-class amenities meet a slower, more intentional pace of life. With its peaceful atmosphere, equestrian properties, and easy access to both Franklin and I-65, College Grove offers a rare blend of rural serenity and refined living that feels both secluded and perfectly connected.
6,632 people live in College Grove, where the median age is 45.5 and the average individual income is $91,200. Data provided by the U.S. Census Bureau.
Total Population
Median Age
Population Density Population Density This is the number of people per square mile in a neighborhood.
Average individual Income
There's plenty to do around College Grove, including shopping, dining, nightlife, parks, and more. Data provided by Walk Score and Yelp.
Explore popular things to do in the area, including Hatcher Family Dairy, Grindstone Cowboy, and Delvin Farms.
| Name | Category | Distance | Reviews |
Ratings by
Yelp
|
|---|---|---|---|---|
| Dining · $ | 2.67 miles | 22 reviews | 4.9/5 stars | |
| Dining · $$ | 4.52 miles | 78 reviews | 4.6/5 stars | |
| Dining · $$ | 4.43 miles | 11 reviews | 4.5/5 stars | |
|
|
||||
|
|
||||
|
|
||||
|
|
||||
|
|
||||
|
|
College Grove has 2,503 households, with an average household size of 2.65. Data provided by the U.S. Census Bureau. Here’s what the people living in College Grove do for work — and how long it takes them to get there. Data provided by the U.S. Census Bureau. 6,632 people call College Grove home. The population density is 93 and the largest age group is Data provided by the U.S. Census Bureau.
Total Population
Population Density Population Density This is the number of people per square mile in a neighborhood.
Median Age
Men vs Women
Population by Age Group
0-9 Years
10-17 Years
18-24 Years
25-64 Years
65-74 Years
75+ Years
Education Level
Total Households
Average Household Size
Average individual Income
Households with Children
With Children:
Without Children:
Marital Status
Blue vs White Collar Workers
Blue Collar:
White Collar: